Strength is one of the most misunderstood qualities in fitness. Many people judge it based on appearance. Others assume that lifting heavy in a single exercise tells the whole story. Some athletes even believe that body weight alone determines how strong someone should be. The reality is more complex.
Strength is not defined by a single lift, a physique photo, or a social media clip. Researchers and coaches have spent decades studying how strength develops and how it can be measured. Their findings consistently show that true strength is multi dimensional. It reflects not only how much force you can produce, but also how efficiently your nervous system recruits muscle fibers, how well you maintain strength relative to body weight, and how your strength compares to population norms.
If you want an honest assessment of your physical capabilities, there are five numbers that provide an unusually clear picture. These metrics are supported by sports science research and are widely used by strength coaches, exercise physiologists, and athletic performance specialists. Together, they reveal far more than any mirror ever could.
Why Measuring Strength Matters
Strength is not only important for athletic performance. It is one of the strongest predictors of long term health, independence, injury resilience, and even mortality risk.
Research consistently shows that greater muscular strength is associated with lower risk of cardiovascular disease, lower all cause mortality, better metabolic health, improved bone density, and enhanced quality of life throughout aging. From a performance perspective, strength serves as the foundation for power, speed, jumping ability, sprinting performance, and athletic success across many sports.
Because strength affects so many areas of life, measuring it accurately is essential. The following five numbers provide a science based framework for understanding your true strength level.
Number 1: Your Relative Strength Ratio
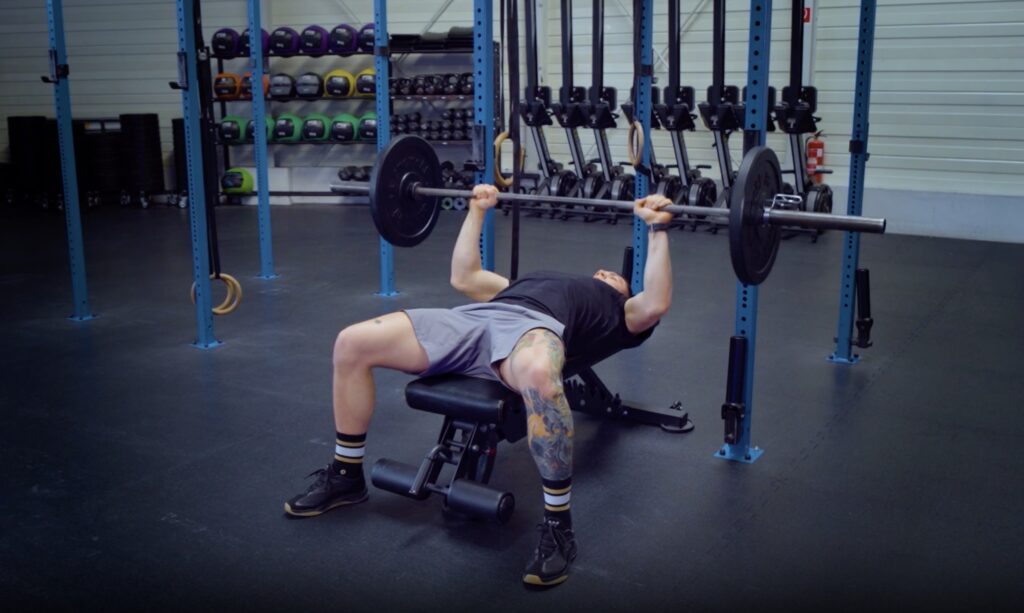
Absolute strength refers to the total amount of weight you can lift. Relative strength refers to how strong you are compared to your body weight. This distinction is critical.

A 300 pound athlete who squats 500 pounds is undeniably strong. However, a 150 pound athlete who squats 350 pounds demonstrates greater relative strength.
Researchers often use relative strength because it allows meaningful comparisons between individuals of different sizes. Relative strength is especially important in sports that require athletes to move their own bodies through space, such as gymnastics, climbing, martial arts, sprinting, and CrossFit.
How to Calculate Relative Strength
The simplest formula is:
Relative Strength = Weight Lifted ÷ Body Weight
For example:
If you weigh 180 pounds and deadlift 405 pounds:
405 ÷ 180 = 2.25
Your relative deadlift strength is 2.25 times your body weight.
What Good Relative Strength Looks Like
For recreationally trained men:
- A squat equal to body weight represents a beginner level.
- A squat of 1.5 times body weight is considered intermediate.
- A squat of 2 times body weight is advanced.
- A squat of 2.5 times body weight is elite.
For women:
- A squat equal to body weight is a solid benchmark.
- A squat of 1.5 times body weight is advanced.
- A squat approaching 2 times body weight is exceptional.
- Relative strength is often a better indicator of athletic performance than absolute strength because athletes must move their own mass efficiently.
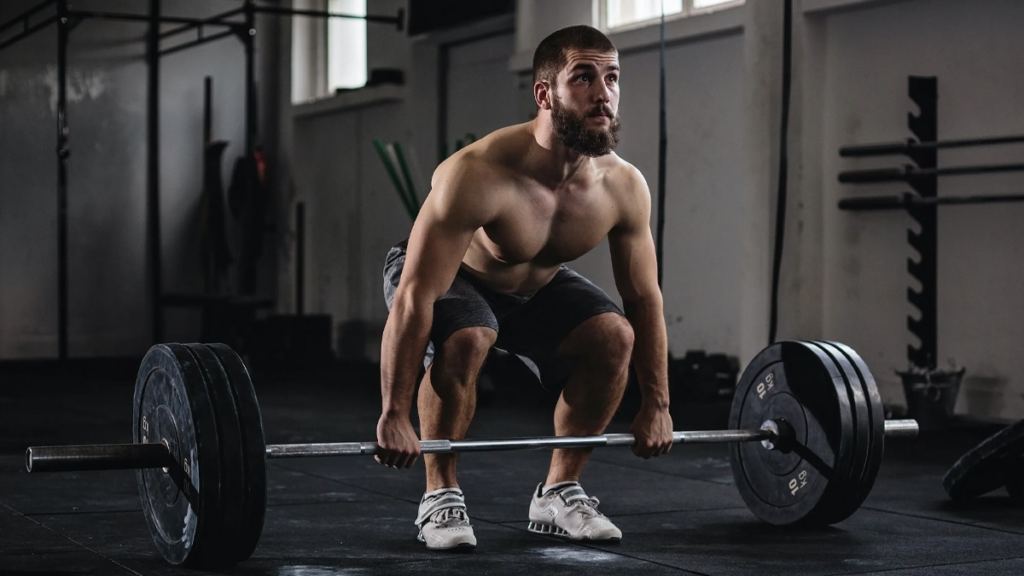
Number 2: Your Deadlift to Body Weight Multiple
If one lift deserves special attention, it is the deadlift.
The deadlift involves nearly every major muscle group in the body, including the glutes, hamstrings, spinal erectors, lats, core musculature, and grip muscles. Because it requires coordination across the entire posterior chain, it is one of the most comprehensive measures of total body strength.
Researchers frequently use deadlift performance as a practical indicator of overall strength capacity.
Why the Deadlift Is So Informative
Unlike many exercises, the deadlift starts from a dead stop. There is no stretch reflex or momentum to assist the lift. Success depends on generating high levels of force from a static position.
The deadlift also correlates strongly with athletic qualities such as sprinting speed, jumping performance, and force production.
Deadlift Standards
For men:
- A deadlift of 1.5 times body weight indicates good strength.
- A deadlift of 2 times body weight indicates advanced strength.
- A deadlift of 2.5 times body weight is highly impressive.
- A deadlift of 3 times body weight is elite.
For women:
- A deadlift of 1.5 times body weight is strong.
- A deadlift of 2 times body weight is advanced.
- A deadlift above 2.5 times body weight is exceptional.
- These numbers provide a powerful snapshot of whole body force production.
What Research Says
Studies examining strength athletes consistently show that deadlift performance is strongly associated with maximal force production and neuromuscular efficiency.
Because the movement requires substantial recruitment of large muscle groups, it serves as a reliable indicator of overall strength development.
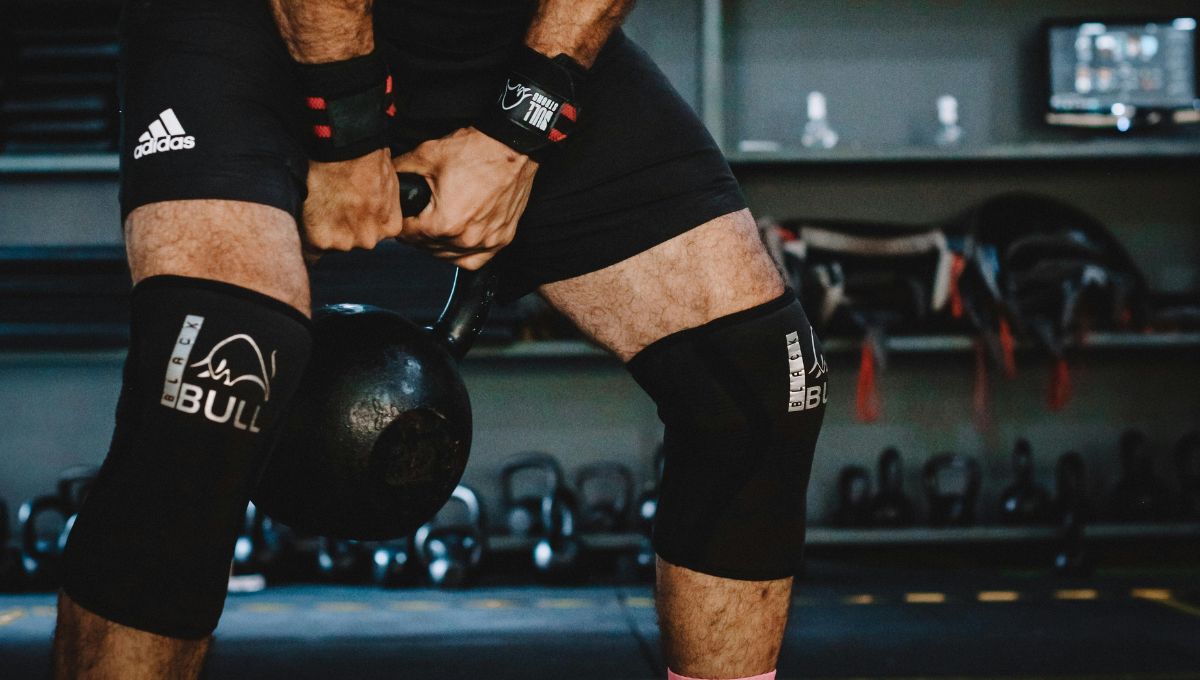
Number 3: Your Grip Strength
Grip strength may seem like a small detail, but it is one of the most powerful health and performance markers ever identified. Researchers have repeatedly found that grip strength predicts health outcomes more accurately than many traditional medical risk factors.

In large population studies, lower grip strength has been associated with increased risk of cardiovascular disease, disability, hospitalization, and premature mortality.
Why Grip Strength Matters
Grip strength reflects more than hand strength. It serves as a proxy for overall muscular function and nervous system health. A strong grip often indicates better whole body strength and neuromuscular integrity.
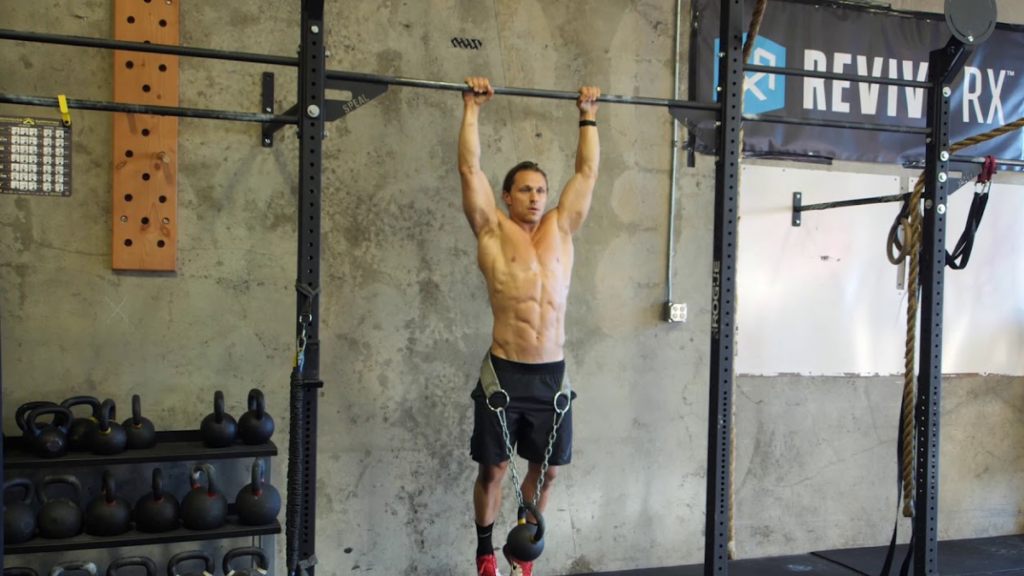
Athletically, grip strength influences performance in deadlifts, pull ups, rowing, climbing, wrestling, judo, Brazilian jiu jitsu, strongman competitions, and many other activities.
Grip Strength Benchmarks
Men aged 20 to 39:
- Below 35 kilograms suggests below average strength.
- 40 to 50 kilograms indicates good strength.
- Above 55 kilograms indicates excellent strength.
Women aged 20 to 39:
- Below 20 kilograms suggests below average strength.
- 25 to 30 kilograms indicates good strength.
- Above 35 kilograms indicates excellent strength.
Measuring Grip Strength
A hand dynamometer is the gold standard tool. Most sports science laboratories and many fitness facilities use these devices because they provide quick and highly reliable measurements.
The number may appear simple, but it reveals an enormous amount about physical capacity and long term health.
Number 4: Your Strength Symmetry Score
Many people focus only on how much weight they lift. Few pay attention to whether strength is distributed evenly throughout the body. This is a mistake.
Significant left to right asymmetries increase injury risk and may reduce athletic performance. Researchers studying athletes consistently find that large strength imbalances are associated with greater incidence of lower body injuries and reduced movement efficiency.
Understanding Symmetry
Symmetry refers to how closely the strength of one side matches the other. For example:
If your right leg can produce 100 pounds of force and your left leg can produce 90 pounds, the difference is 10 percent. Most experts consider asymmetries below 10 percent acceptable. Differences above 15 percent may warrant targeted intervention.
How to Assess Strength Symmetry
Single leg exercises provide useful information.
Examples include:
- Single leg squats.
- Bulgarian split squats.
- Single leg leg presses.
- Single arm presses.
- Single arm rows.
Force plates and isokinetic dynamometers provide more precise measurements, but practical gym testing can still reveal meaningful differences.
Why Symmetry Matters
Athletes with balanced strength tend to move more efficiently and distribute force more effectively. Balanced strength also reduces compensatory movement patterns that can place excessive stress on joints and connective tissues. A perfectly balanced athlete is rare, but minimizing major asymmetries is an important component of long term strength development.
Number 5: Your Strength to Muscle Mass Ratio
Many people assume larger muscles automatically mean greater strength. The relationship exists, but it is not perfect.
Muscle size contributes significantly to force production, yet neural adaptations play a major role as well. This explains why some relatively small athletes outperform much larger individuals in strength tests.
Understanding Strength Efficiency
Strength to muscle mass ratio measures how much force you generate relative to the amount of muscle you carry. Powerlifters, Olympic weightlifters, and gymnasts often display remarkable efficiency in this area. They may not possess the largest muscles, but they produce exceptional force.
The Science Behind It
Early strength gains from resistance training occur primarily through neural adaptations rather than muscle growth. The nervous system becomes better at recruiting motor units, synchronizing muscle activity, and increasing firing rates.
As training continues, muscle hypertrophy contributes more significantly to strength development. The strongest athletes generally combine substantial muscle mass with highly efficient neural recruitment.
Practical Assessment
A useful approach is to compare your strength levels against your lean body mass.
For example:
- Two athletes each deadlift 500 pounds.
- Athlete A carries 180 pounds of lean mass.
- Athlete B carries 210 pounds of lean mass.
- Athlete A demonstrates greater strength efficiency.
This metric helps reveal how effectively your body converts muscle into force.
Wrapping it Up
Real strength cannot be judged by a big bench press, a single impressive lift, or a muscular physique alone. A far more accurate assessment comes from looking at five key metrics that together provide a complete picture of physical capability. Your relative strength ratio shows how effectively you can move your own body weight, while your deadlift to body weight multiple reflects your ability to generate total body force.
Grip strength offers valuable insight into overall muscular function and has even been linked to long term health outcomes.
Your symmetry score highlights how balanced your strength is between limbs, which can influence both performance and injury risk. Finally, your strength to muscle mass ratio reveals how efficiently your body converts muscle into force. By tracking these numbers over time, you can gain a deeper understanding of your true strength level and identify specific areas for improvement. Ultimately, strength is not just about lifting heavier weights. It is about building a body that produces force efficiently, moves well, stays resilient under physical demands, and supports health and performance for years to come.
Key Takeaways
| Metric | What It Measures | Strong Benchmark |
|---|---|---|
| Relative Strength Ratio | Strength compared to body weight | Squat at 2 times body weight for men, 1.5 to 2 times for women |
| Deadlift Multiple | Whole body force production | Deadlift at 2 times body weight or higher |
| Grip Strength | Overall muscular function and health | Above 55 kg for men, above 35 kg for women |
| Strength Symmetry | Balance between limbs | Less than 10% difference between sides |
| Strength to Muscle Mass Ratio | Force production efficiency | Higher strength output with less lean mass |
Bibliography
• Bohannon, R.W. (2019) ‘Grip strength: An indispensable biomarker for older adults’, Clinical Interventions in Aging, 14, pp. 1681 to 1691.
• Delmonico, M.J., Kostek, M.C., Johns, J., Hurley, B.F. and Conway, J.M. (2007) ‘Can dual energy X ray absorptiometry provide a valid assessment of changes in thigh muscle mass with strength training in older adults?’, European Journal of Clinical Nutrition, 62(12), pp. 1372 to 1378.
• Fragala, M.S., Alley, D.E., Shardell, M.D., Harris, T.B., McLean, R.R., Kiel, D.P., Cawthon, P.M., Dam, T.T., Ferrucci, L. and Guralnik, J.M. (2016) ‘Comparison of handgrip and leg extension strength in predicting slow gait speed in older adults’, Journal of the American Geriatrics Society, 64(1), pp. 144 to 150.
• Garcia Ramos, A., Haff, G.G., Pestaña Melero, F.L., Pérez Castilla, A. and Rojas, F.J. (2018) ‘Mean velocity vs. percentage of one repetition maximum relationship in deadlift exercise’, International Journal of Sports Science & Coaching, 13(5), pp. 724 to 729.
• Granacher, U., Muehlbauer, T., Gollhofer, A., Kressig, R.W. and Zahner, L. (2011) ‘An intergenerational approach in the promotion of balance and strength for fall prevention’, Gerontology, 57(4), pp. 304 to 315.
• Häkkinen, K., Pakarinen, A., Alén, M., Kauhanen, H. and Komi, P.V. (1988) ‘Neuromuscular and hormonal adaptations in athletes to strength training in two years’, Journal of Applied Physiology, 65(6), pp. 2406 to 2412.
• Leong, D.P., Teo, K.K., Rangarajan, S., Lopez Jaramillo, P., Avezum, A., Orlandini, A., Seron, P., Ahmed, S.H., Rosengren, A. and Yusuf, S. (2015) ‘Prognostic value of grip strength: Findings from the Prospective Urban Rural Epidemiology study’, The Lancet, 386(9990), pp. 266 to 273.