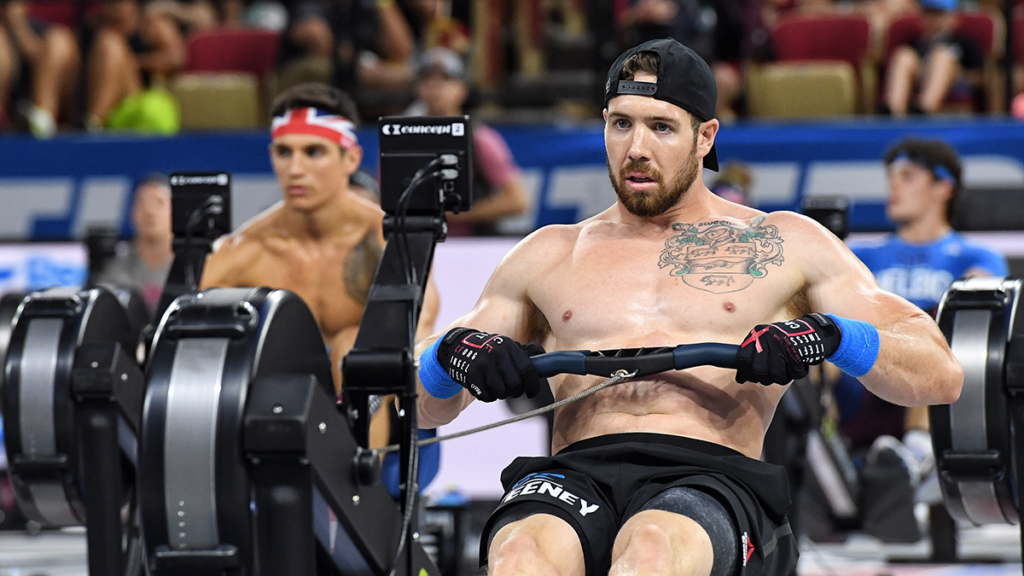
Whether you are strapping into a Concept2 at your local CrossFit box or fine tuning your aerobic engine for a competitive rowing season, the two thousand meter row remains a fantastic benchmark of human endurance, power, and mental toughness.
This distance is universally recognized as the gold standard of rowing tests because it perfectly bridges the gap between pure explosive power and sustained aerobic capacity.
Almost every athlete who sits down on an indoor rower eventually asks themselves the exact same question: how does my score compare to people my own age and sex, and what does it actually take to reach elite performance? The answer to that question involves a fascinating interplay of biomechanics, physiological adaptation, and cardiovascular energy systems.
So let’s dive into it.
The Science of the 2,000m Ergometer Test
The two thousand meter row is widely regarded by exercise physiologists as one of the most demanding physical evaluations in sport. During a maximal effort test, the body relies heavily on two primary energy systems to keep the handle moving.
Approximately seventy to eighty percent of the energy required during a 2,000m effort comes from aerobic metabolism, while the remaining twenty to thirty percent is generated anaerobically. This means that an athlete must possess a massive maximal oxygen consumption capacity while simultaneously tolerating extreme accumulation of metabolic byproducts like hydrogen ions and lactate in the bloodstream.

Physiological research demonstrates that stroke volume, muscle fiber type distribution, and total body mass play enormous roles in determining indoor rowing efficiency. Because the ergometer is a non weight bearing machine, having a higher overall body mass with significant lean muscle tissue provides a distinct leverage advantage.
The drive phase requires forceful contraction of the quadriceps, gluteal muscles, and latissimus dorsi, while the recovery phase demands exceptional muscle coordination and postural control. Athletes who achieve top tier times possess an efficient blend of high mechanical peak power and the metabolic flexibility required to clear lactate rapidly during the middle portion of the piece.
Physiological Differences Across Biological Sexes
When comparing rowing performance between men and women, biological differences in body composition, heart size, and hemoglobin concentrations account for the variation in absolute scores. On average, male athletes possess larger thoracic cavities, larger heart stroke volumes, and higher levels of circulating hemoglobin, which allows for greater absolute oxygen transport to working muscles. Additionally, higher natural levels of testosterone contribute to a greater total quantity of skeletal muscle mass and higher absolute peak power output per stroke.
Female athletes, however, often display superior fatigue resistance and metabolic efficiency relative to their total lean muscle mass. Studies in neuromuscular physiology highlight that women typically utilize a higher percentage of oxidative muscle fibers during high intensity efforts, allowing for remarkable consistency across pacing splits. When benchmarks are normalized for lean body mass rather than absolute mass, the performance gap narrows significantly. Understanding these baseline physiological distinctions ensures that training expectations remain realistic, safe, and scientifically grounded.
Benchmark 2,000m Row Times by Sex and Age Group
To determine where your score falls, exercise scientists and rowing coaches categorize standards into distinct percentile tiers based on thousands of verified Concept2 logbook entries. A novice time reflects an athlete who has recently learned proper technique and built baseline aerobic conditioning. An intermediate time represents a dedicated gym goer or recreational rower with consistent training experience. Advanced times belong to competitive club rowers and high level fitness athletes, while elite times represent national caliber competitors and collegiate division one rowers.
The following data provides realistic, age adjusted benchmarks measured in minutes and seconds across five major age categories. These figures reflect non lightweight performance standards across general athletic populations.
Male 2,000m Rowing Standards
Male performance standards reflect the influence of absolute leverage and muscular strength alongside cardiovascular conditioning. Peak physiological power typically occurs between twenty and twenty nine years of age, after which age related declines in maximal heart rate and aerobic capacity gradually shift the benchmark standards upward.
2,000m Row Times for Male Athletes by Age Group
| Age Group | Novice Standard | Intermediate Standard | Advanced Standard | Elite Standard |
|---|---|---|---|---|
| 18 to 29 | 08:00 | 07:05 | 06:25 | 05:55 |
| 30 to 39 | 08:15 | 07:15 | 06:35 | 06:05 |
| 40 to 49 | 08:30 | 07:30 | 06:45 | 06:15 |
| 50 to 59 | 08:50 | 07:48 | 07:00 | 06:30 |
| 60 plus | 09:15 | 08:10 | 07:20 | 06:50 |
Female 2,000m Rowing Standards
Female performance benchmarks illustrate similar age related trajectories, with the highest relative power output occurring during the late teens through the late twenties. Consistent endurance training significantly mitigates the rate of decline in oxygen capacity across subsequent decades.
2,000m Row Times for Female Athletes by Age Group
| Age Group | Novice Standard | Intermediate Standard | Advanced Standard | Elite Standard |
|---|---|---|---|---|
| 18 to 29 | 09:10 | 08:15 | 07:30 | 06:50 |
| 30 to 39 | 09:25 | 08:25 | 07:40 | 07:00 |
| 40 to 49 | 09:40 | 08:40 | 07:52 | 07:12 |
| 50 to 59 | 10:00 | 09:00 | 08:10 | 07:30 |
| 60 plus | 10:30 | 09:25 | 08:35 | 07:50 |
How Age Impacts Rowing Performance and Recovery
The aging process introduces predictable physiological changes that directly influence indoor rowing output. Starting around the third decade of life, maximal oxygen consumption declines by approximately seven to ten percent per decade in untrained individuals, though high intensity aerobic exercise can cut this rate of decline in half. This physiological shift is primarily driven by a age related reduction in maximum heart rate, reduced capillary density in active skeletal muscle, and a gradual decrease in left ventricular compliance within the heart.
Furthermore, age related muscle loss, known clinically as sarcopenia, preferentially affects fast twitch type two muscle fibers. Because the drive phase of the rowing stroke relies heavily on rapid force development, older rowers often experience a slight reduction in maximum stroke power. Joint stiffness and changes in connective tissue elasticity can also reduce stroke length at the catch, requiring older athletes to rely more heavily on hyper efficient pacing strategies and fluid stroke rate control to maintain high split speeds.
Mitigating Age Related Performance Declines
Fortunately, targeted strength training and strategic conditioning can dramatically preserve rowing power well into older age. Heavy resistance training focusing on multi joint movements like deadlifts, squats, and bent over rows stimulates motor unit recruitment and preserves muscle fiber size. Incorporating low intensity, steady state cardio builds mitochondrial density, ensuring that the aerobic engine remains robust across decades of training.

Proper recovery management becomes equally critical as rowers age. Sleep hygiene, adequate protein intake, and scheduled deload weeks allow connective tissues to repair and adapt without overreaching. Older rowers who prioritize soft tissue mobility and movement quality frequently outperform younger rowers who rely solely on raw strength without refined technical efficiency.
Key Factors That Influence Your 2,000m Score
Beyond age and biological sex, several controllable variables significantly impact the time displayed on the monitor at the end of a painful two thousand meter effort. Master these factors, and you will instantly shave valuable seconds off your personal best score.
Biomechanics and Stroke Efficiency
Rowing is fundamentally a mechanical sequence where energy is transferred from the legs, through the core, and into the handle via the arms. The optimal force application order during the drive is sixty percent leg drive, thirty percent trunk extension, and ten percent arm pull. A common technical flaw among self taught indoor rowers is bending the arms too early or opening the torso before the legs have fully extended. This leaks power and causes premature muscle fatigue in the upper back and biceps. Maintaining a relaxed grip, engaged lats, and a fluid sequencing on both the drive and the recovery maximizes meter output per stroke while keeping heart rate under control.
Pacing Strategy and Energy Distribution
Attempting to fly out of the gate with an unsustainable stroke rate is the single fastest way to blow up during a 2,000m test. Research on pacing strategies in rowing consistently shows that a negative split or a controlled even split strategy yields the fastest total completion times. An even pacing strategy involves holding a consistent split pace for the middle fifteen hundred meters, followed by a controlled sprint over the final two hundred and fifty meters. Going out too hard in the first five hundred meters causes premature accumulation of blood lactate and acidosis, forcing the athlete to dramatically slow down during the brutal third quarter of the piece.
3 Huge Benefits of EZ Bar Curls for Beginners that Want Bigger Biceps
Damper Setting and Drag Factor
Many athletes mistakenly confuse the damper lever on the side of the flywheel with a resistance setting on a exercise bike. The damper setting actually controls the amount of airflow entering the flywheel housing, which alters the rate at which the wheel decelerates.
This relationship is measured digitally as the drag factor. Setting the damper too high creates an excessively heavy feeling at the catch, increasing the risk of lower back strain and causing rapid muscular fatigue. For most general fitness athletes and competitive rowers, a drag factor between one hundred and fifteen and one hundred and thirty five provides the ideal balance of flywheel momentum and mechanical leverage.
Key Takeaways
| Topic | Primary takeaway |
|---|---|
| Primary Energy System | The 2,000m row is roughly 75% aerobic and 25% anaerobic, requiring a large VO2 max and high acid tolerance. |
| Average Benchmark | A good intermediate 2,000m row time ranges between 7:05 to 7:48 for men and 8:15 to 9:00 for women aged 18 to 59. |
| Impact of Aging | Maximal heart rate and fast twitch muscle fibers decline with age, but consistent strength and endurance training minimizes this loss. |
| Optimal Pacing | Even pacing or negative splitting prevents early lactate accumulation and yields significantly faster total times than flying out too fast. |
| Drag Factor Setup | Keep the drag factor between 115 and 135 to ensure smooth flywheel acceleration without straining the spine. |
References
Fiskerstrand, A. and Seiler, K.S., 2004. Training and performance characteristics among Norwegian international rowers 1970–2001. Scandinavian Journal of Medicine & Science in Sports, 14(5), pp.303-310.
Ingham, S.A., Whyte, G.P., Jones, K. and Nevill, A.M., 2002. Determinants of 2,000 m rowing ergometer performance in elite rowers. European Journal of Applied Physiology, 88(1-2), pp.243-246.
Mavroudis, M., Methenitis, S., Papadopoulos, C., Ploutarhou, N. and Terzis, G., 2020. Physiological predictors of 2000-m rowing ergometer performance in competitive rowers. Journal of Sports Medicine and Physical Fitness, 60(8), pp.1075-1082.
Nevill, A.M., Ingham, S.A., Whyte, G.P. and Jones, K., 2005. Modeling the impact of body mass and power output on 2000-m rowing ergometer performance. European Journal of Applied Physiology, 95(1), pp.120-125.
Seiler, S. and Tønnessen, E., 2013. Intervals, thresholds, and long slow distance: the physiological basis of physiological training zones. Sportscience, 13, pp.32-53.
Steinacker, J.M., 1993. Physiological aspects of training in rowing. International Journal of Sports Medicine, 14(S1), pp.S3-S10.